Not Just My Code: How to debug third party libraries without decompiling them
Intro


So I'm back... writing another blogpost. Hope this would be good one.
Problem
If you are using any third party library you probably know the pain you are getting if something works not as you expected...
Imagine the most common scenario - you have a website which uses third party library. Basically it's DLL which provides some integration points for you. You try to integrate with it, it doesn't work but you have no idea why. If it was your code you could have debugged it, but what if you don't have the code? Usually in my case this meant reverse engineering and decompiling using tools like ILSpy, and replacing OOTB code to be able to debug it step by step.... But is it really the only way to do it?
Imagine the most common scenario - you have a website which uses third party library. Basically it's DLL which provides some integration points for you. You try to integrate with it, it doesn't work but you have no idea why. If it was your code you could have debugged it, but what if you don't have the code? Usually in my case this meant reverse engineering and decompiling using tools like ILSpy, and replacing OOTB code to be able to debug it step by step.... But is it really the only way to do it?
Solution
Fortunately there is a better way.
Step 1 - Generate symbols using decompiling tool dotPeek.
When library is built in Visual Studio it's it's also supplied with *.PDB files which contains all the information about how to debug it. Unfortunately if you are using third party dlls you are most likely not supplied with symbol files. Developers don't expect you to debug their code! (probably because they think there is no bugs there?)
Offtop note: PDB files are not only used for debugging, but also they are used to show detailed information about exception source in stack trace (like code line numbers).
Fortunately there is great tools like JetBrains dotPeek that allow to not only decompile third party .NET libraries (which is also handy), but also generate that .PDB files.
So now we have generated debug database files which we can use... but this is not all.
We can also host our own symbol server using dotPeek. I will show later what it does and how much power we can get from this debugging tool!


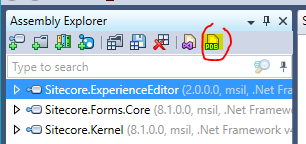
Note: For performance reasons I'd advise to host symbol information only for assemblies in Assembly Explorer.
Step 2 - Configure Visual Studio with new symbol source
Now when our symbol server is running we need to add it in Visual Studio. Then Visual Studio will know where to search symbols when we are debugging process.
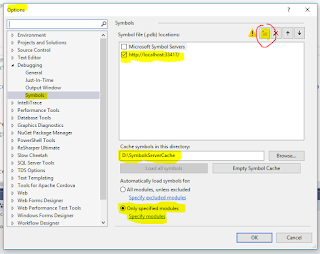
We also need to disable "Just My Code" to enable debugging of third party libraries. As well as we need to enable "Source Server Support".

We also need to add new symbol source in Symbols tab.
Note: For perfomance reasons I'd advise to specify the symbol cache directory, as well as explicitly specify modules which should be loaded from symbol server. This will speed up the loading of symbols from the symbol server.

Step 3 - Loading symbols
So now all set up and we can actually debug our third party DLLs. But we have no access to their source code - how can we debug them?
We have several options depending on the fact do you have Resharper or not. But first let's start debugging.
For an example I've took the code which is integrated into Sitecore (.NET CMS).

As you can see this class is inherited from OpenExperienceEditor class which is third party Sitecore library - Sitecore.ExperienceEditor.dll.
I've added the Sitecore.ExperienceEditor.dll to dotPeek to decompile the source code. This will also mean that it symbols will be available in symbol server.

Now lets debug!
I'll attach to w3wp.exe which is IIS process that hosts my website.
Now we'll go to Debug -> Windows -> Modules to list modules we are using in our solution.
In order to be able to debug the module we need to load the symbols. This will tell Visual Studio to go through symbol sources and locate the library symbols.

Note: If symbols were loaded successfully we'll see "Symbol Status" changed to "Symbols loaded"
Step 4 - Where all the fun begins
Ok... So let's summarise. Symbol server running. Visual Studio know where to find it and we successfully loaded symbols we need to debug third party code.
Now we need to add a breakpoint.
Option 1 - Without Resharper.
Open Debug -> Windows -> Breakpoints and create a new "Function Breakpoint"

We'll need to provide full path including namespace, class name and function name in the dialog.

Now anytime this function is called we'll hit breakpoint!
Option 2 - With Resharper
That's an easy one. Configure Resharper to navigate to source instead of declaration.

Now you can just navigate to class decompiled code and put a breakpoint as usual.

Happy debugging!
Комментарии
Отправить комментарий